AWS has announced enhanced infrastructure observability for SageMaker HyperPod, combining comparisons between accelerators with diagnostic rules for common training problems. The canonical announcement carries a November 20 date and describes support for both EKS and Slurm orchestration.
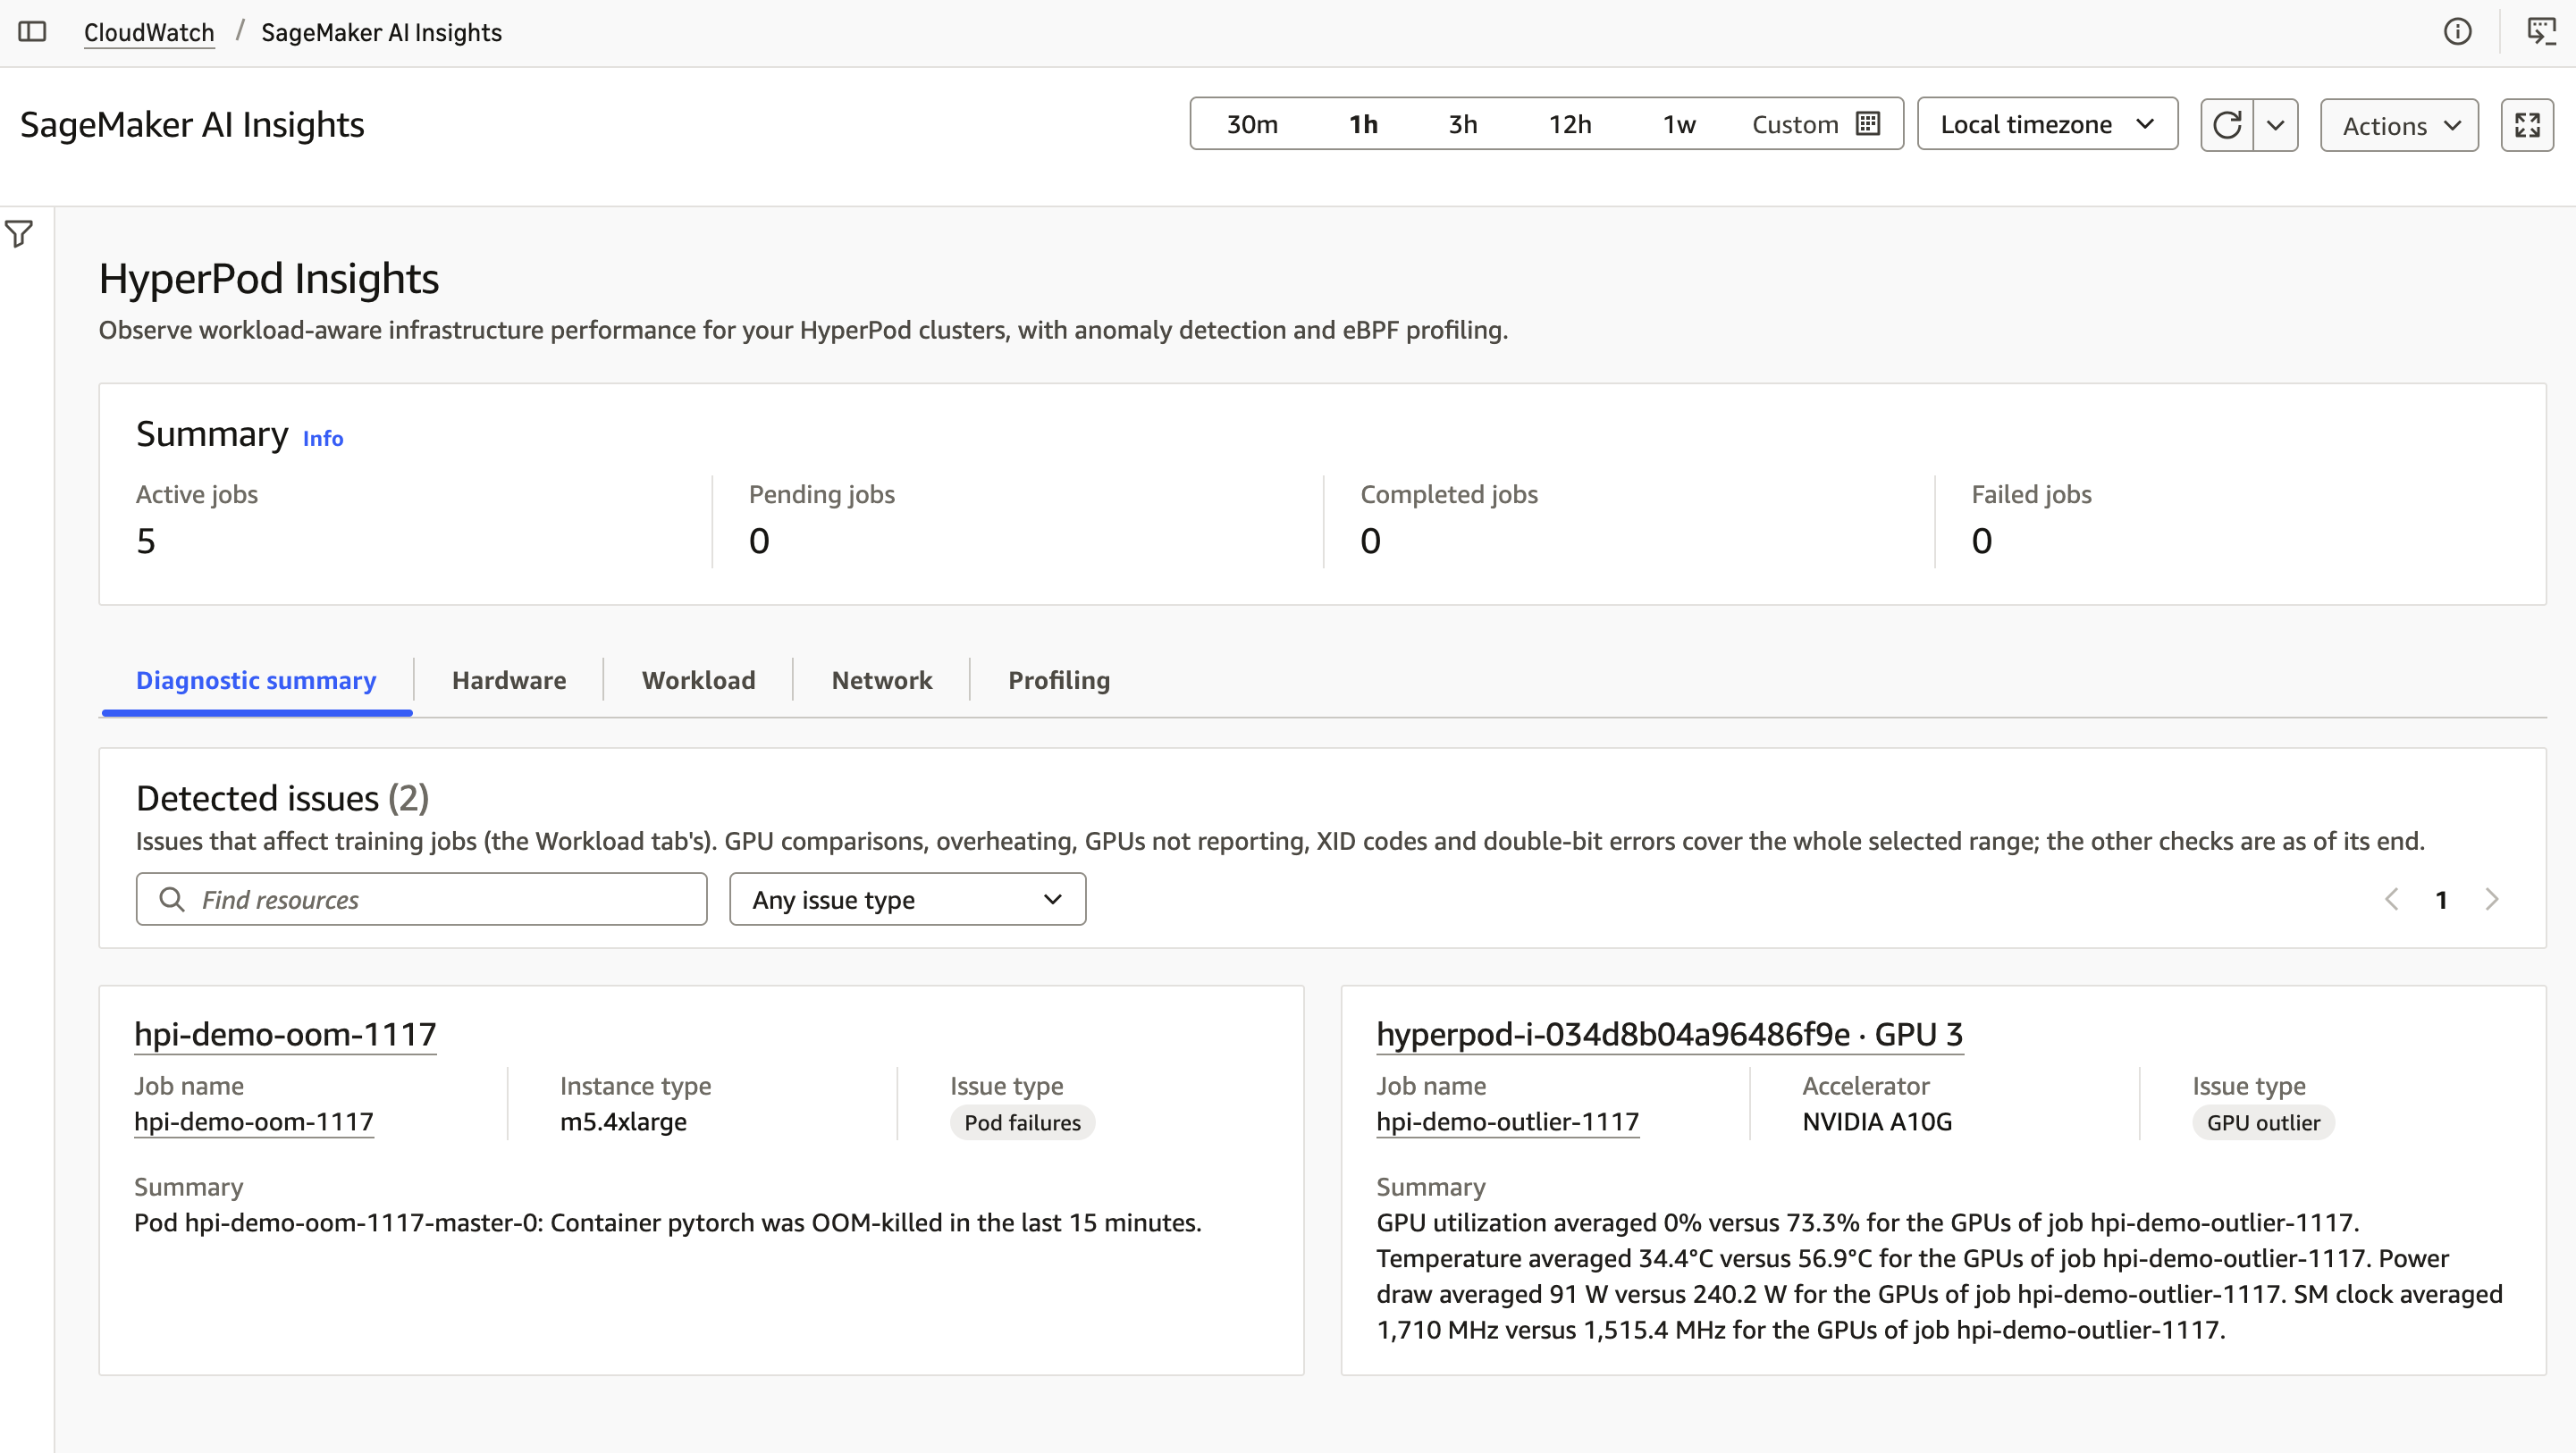
The diagnostic summary uses CloudWatch’s DetectGroupOutliers API to compare GPUs within a training job across utilization, memory, temperature, power and SM clock. Separate rules identify patterns involving hardware errors, network degradation, throttling and overheating.
More than a fleet-average utilization figure
AWS’s example interface connects an issue to the affected job, node and accelerator. That can make an aggregate slowdown easier to investigate, but an outlier is a signal to examine rather than automatic proof of a particular root cause.
Peer comparisons also depend on what the peers are doing. A useful investigation needs workload context as well as device statistics. Our view is that the operational value lies in bringing relevant evidence together, not in treating a dashboard label as the end of diagnosis.
Default collection and deeper telemetry
AWS describes default metrics collected every 30 seconds and optional, more detailed host, accelerator and EFA network metrics. It gives approximate collection overhead figures, which remain publisher estimates rather than measurements from our own cluster.
CloudWatch is now the default metric store, with Amazon Managed Service for Prometheus also offered. More detailed collection increases telemetry volume and can affect the bill. Availability and a useful configuration are separate questions from whether every metric needs to be enabled for every job.
Our analysis: observe enough to answer a question
Monitoring choices are easier to justify when tied to an operational question. If a distributed workload is stalling, operators need evidence that distinguishes compute, communication and input-pipeline behavior. Simply collecting more numbers does not ensure that distinction becomes clear.
It is also useful to decide how an alert will be checked and who can change a configuration. A dashboard is only one part of that workflow. Retention, permissions, diagnostic follow-up and the cost of continuous collection all influence whether the resulting system stays useful.
The announcement describes an add-on for EKS clusters and an extension for Slurm clusters, with configuration controlled through AWS permissions. It says the capability is available in regions where HyperPod is available; readers should check their own region and current service terms.
We reviewed the documentation and official interface examples without opening a console, installing an add-on or provisioning resources. No reduction in troubleshooting time, training cost or failure rate has been independently established by us.
Official background video
This AWS introduction to HyperPod EKS was published February 25, 2026. It explains the broader training and inference platform and predates the observability announcement covered here.
Primary-source review and original editorial analysis. No software installation, model inference, API call, security validation or independent benchmark performed.